View Project Log Data

How to view project log data within multi-tenant logging
You can only view the log data for a Project to which you have been granted access.
Access Project Grafana’s UI
Run the following commands on the management cluster:
Determine the namespace of the workspace that your project is in. You can use the
dkp get workspacescommand to see the list of workspace names and their corresponding namespaces.CODEdkp get workspacesCopy the value under the
NAMESPACEcolumn for your workspace.Export the
WORKSPACE_NAMESPACEvariable:CODEexport WORKSPACE_NAMESPACE=<WORKSPACE_NAMESPACE>Execute the following command to get the namespace of your project
CODEkubectl get projects -n ${WORKSPACE_NAMESPACE}Copy the value under
PROJECT NAMESPACEcolumn for your project. This may NOT be identical to the Display Name of theProject.Export the
PROJECT_NAMESPACEvariable:CODEexport PROJECT_NAMESPACE=<PROJECT_NAMESPACE>Run the following commands on the attached cluster to access the Project Grafana’s UI:
Ensure you switched to the correct context or kubeconfig of the attached cluster for the following kubectl commands:
Get the Grafana URL:
CODEkubectl get ingress -n ${PROJECT_NAMESPACE} ${PROJECT_NAMESPACE}-project-grafana-logging -o go-template='https://{{with index .status.loadBalancer.ingress 0}}{{or .hostname .ip}}{{end}}{{with index .spec.rules 0}}{{with index .http.paths 0}}{{.path }}{{end}}{{end}}{{"\n"}}'
View Logs in Grafana
Go to the
Exploretab:CODEkubectl get ingress -n ${PROJECT_NAMESPACE} ${PROJECT_NAMESPACE}-project-grafana-logging -o go-template='https://{{with index .status.loadBalancer.ingress 0}}{{or .hostname .ip}}{{end}}{{with index .spec.rules 0}}{{with index .http.paths 0}}{{.path }}{{end}}{{end}}/explore{{"\n"}}'You may be prompted to log in using the SSO flow. See Authentication and Authorization for more information.
At the top of the page, change the data source to
Loki.
See the Grafana Loki documentation for more on how to use the interface to view and query logs.
Cert-Manager and Traefik must be deployed in the attached cluster to be able to access the Grafana UI. These are deployed by default on the workspace.
You can configure workspace policy to restrict access to the Project logging Grafana UI. Each Grafana instance in a Project has a unique URL at the cluster level. Consider creating a WorkspaceRoleBinding that maps to a ClusterRoleBinding, on attached cluster(s), for each Project level Grafana instance. For example, If you have a group named sample-group and two projects named first-project and second-project in sample-workspace workspace, then the Role Bindings look similar to the following:
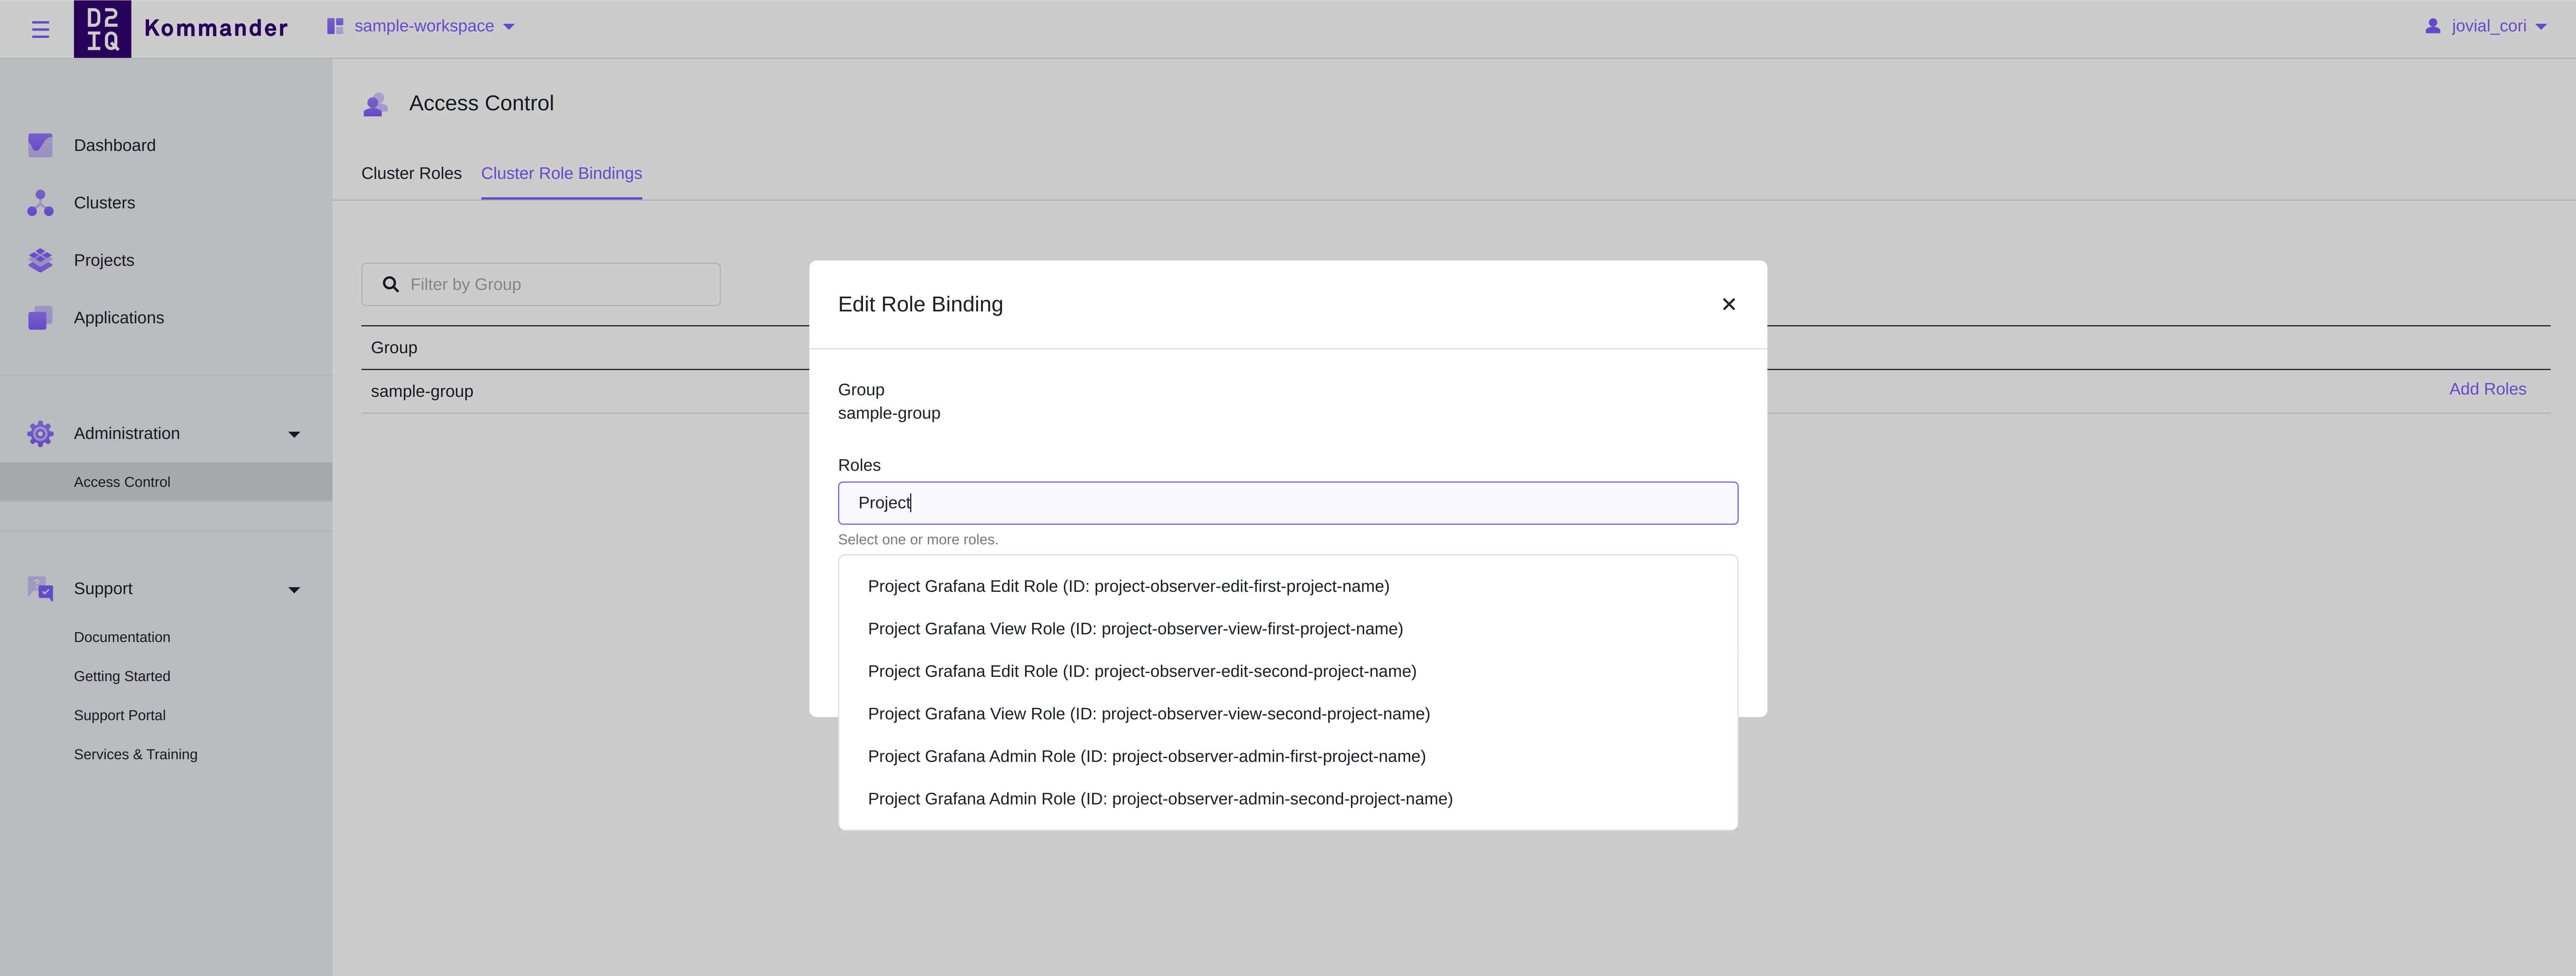
Select the correct role bindings for each group for a project at the workspace level.