Grafana Dashboards
The Kaptain installation also includes two Grafana dashboards, which are automatically imported and ready-to-use.
Access the dashboard
Essential only: select your target workspace from the top menu bar.
Select Cluster from the sidebar menu.
Essential only: if there are several clusters in your workspace, select the card of the cluster that has Kaptain enabled.
In the Application Dashboards tab, navigate to the Grafana card and select Dashboard.
In the Grafana UI, use the Search function to look up the Kaptain dashboards.
Dashboards
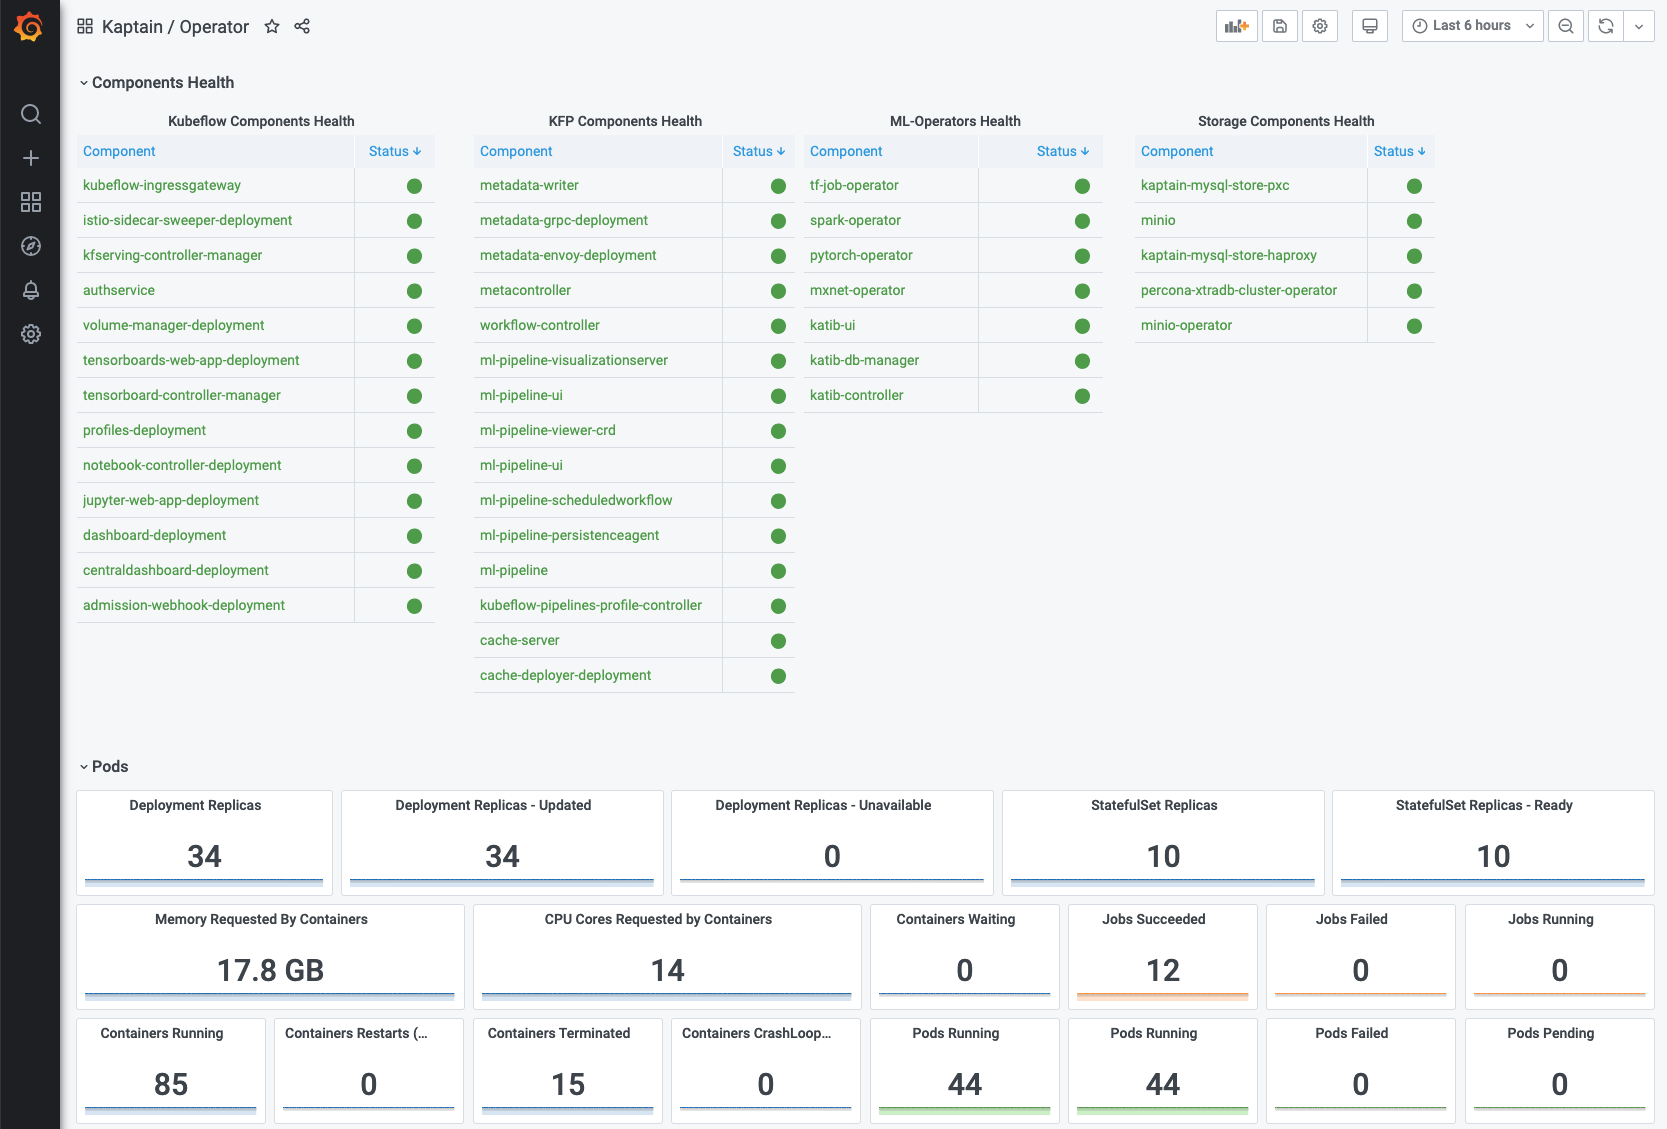
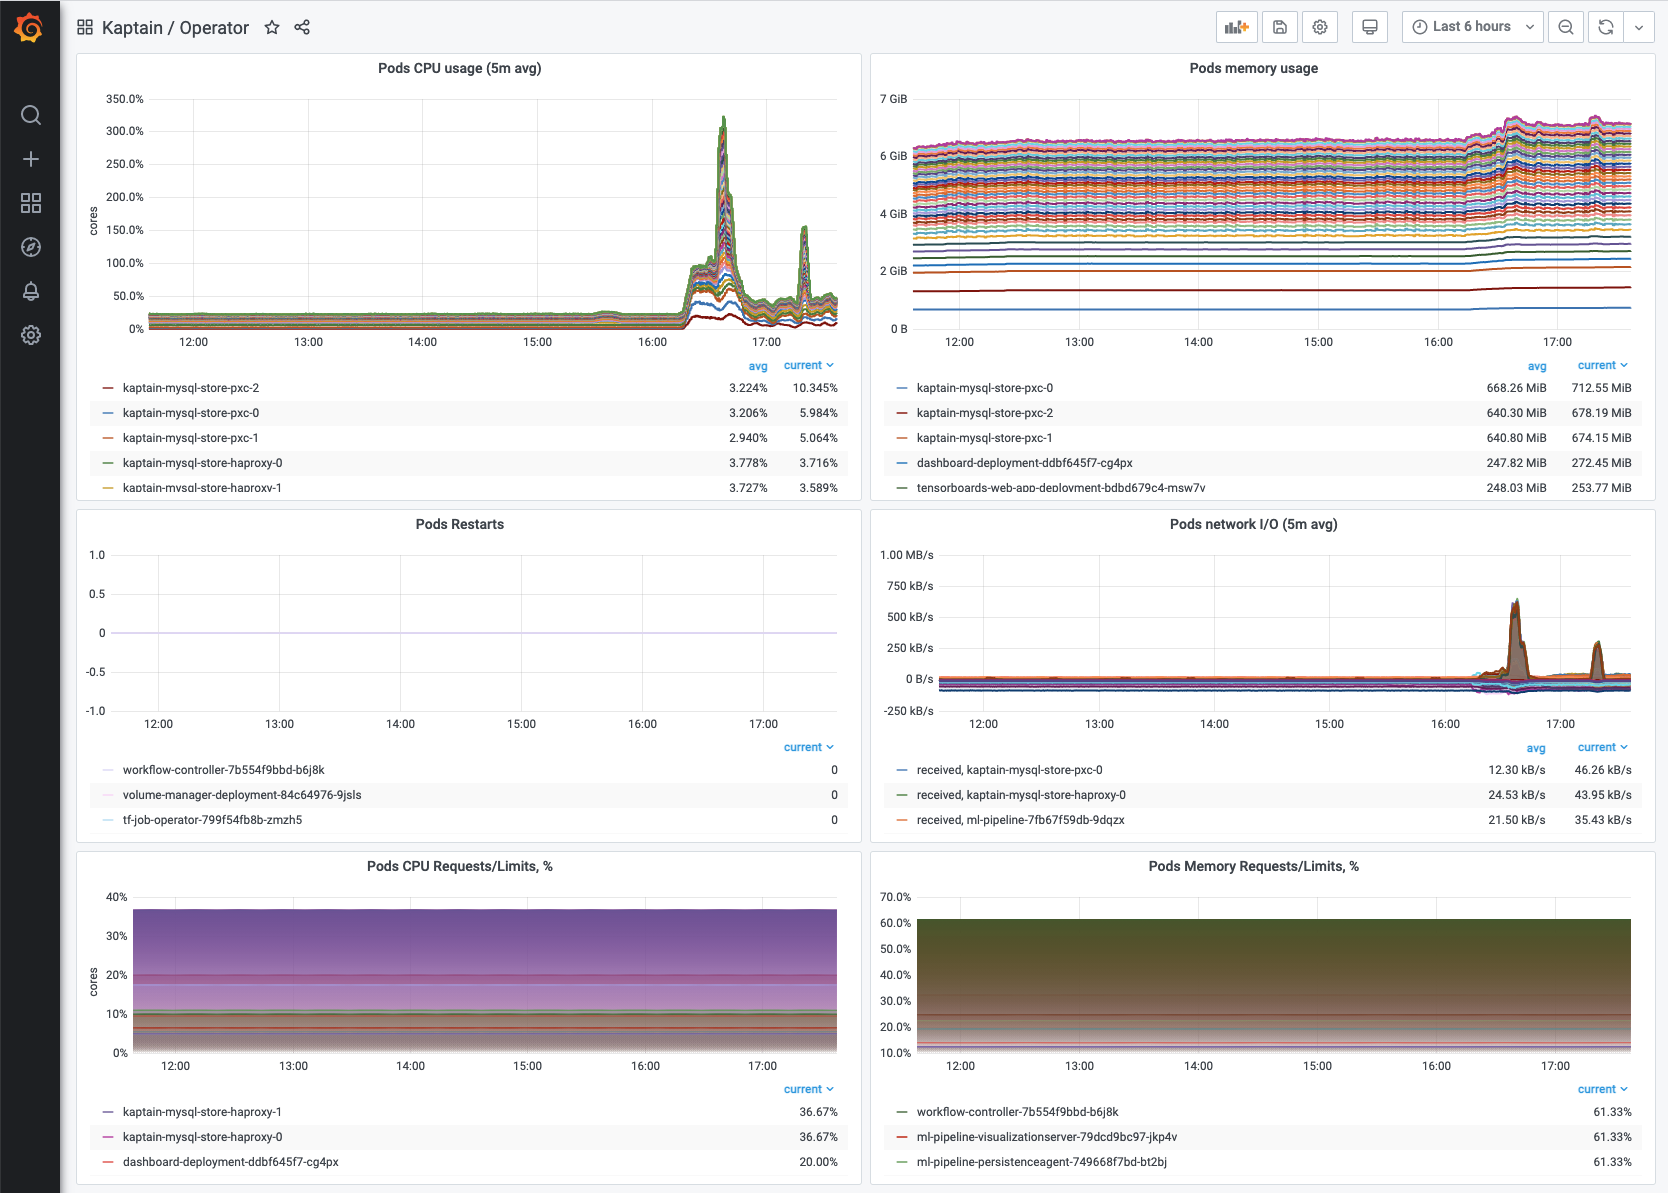
Kaptain / Operator - contains components health, pods state, resource consumption, and ML operator metrics:
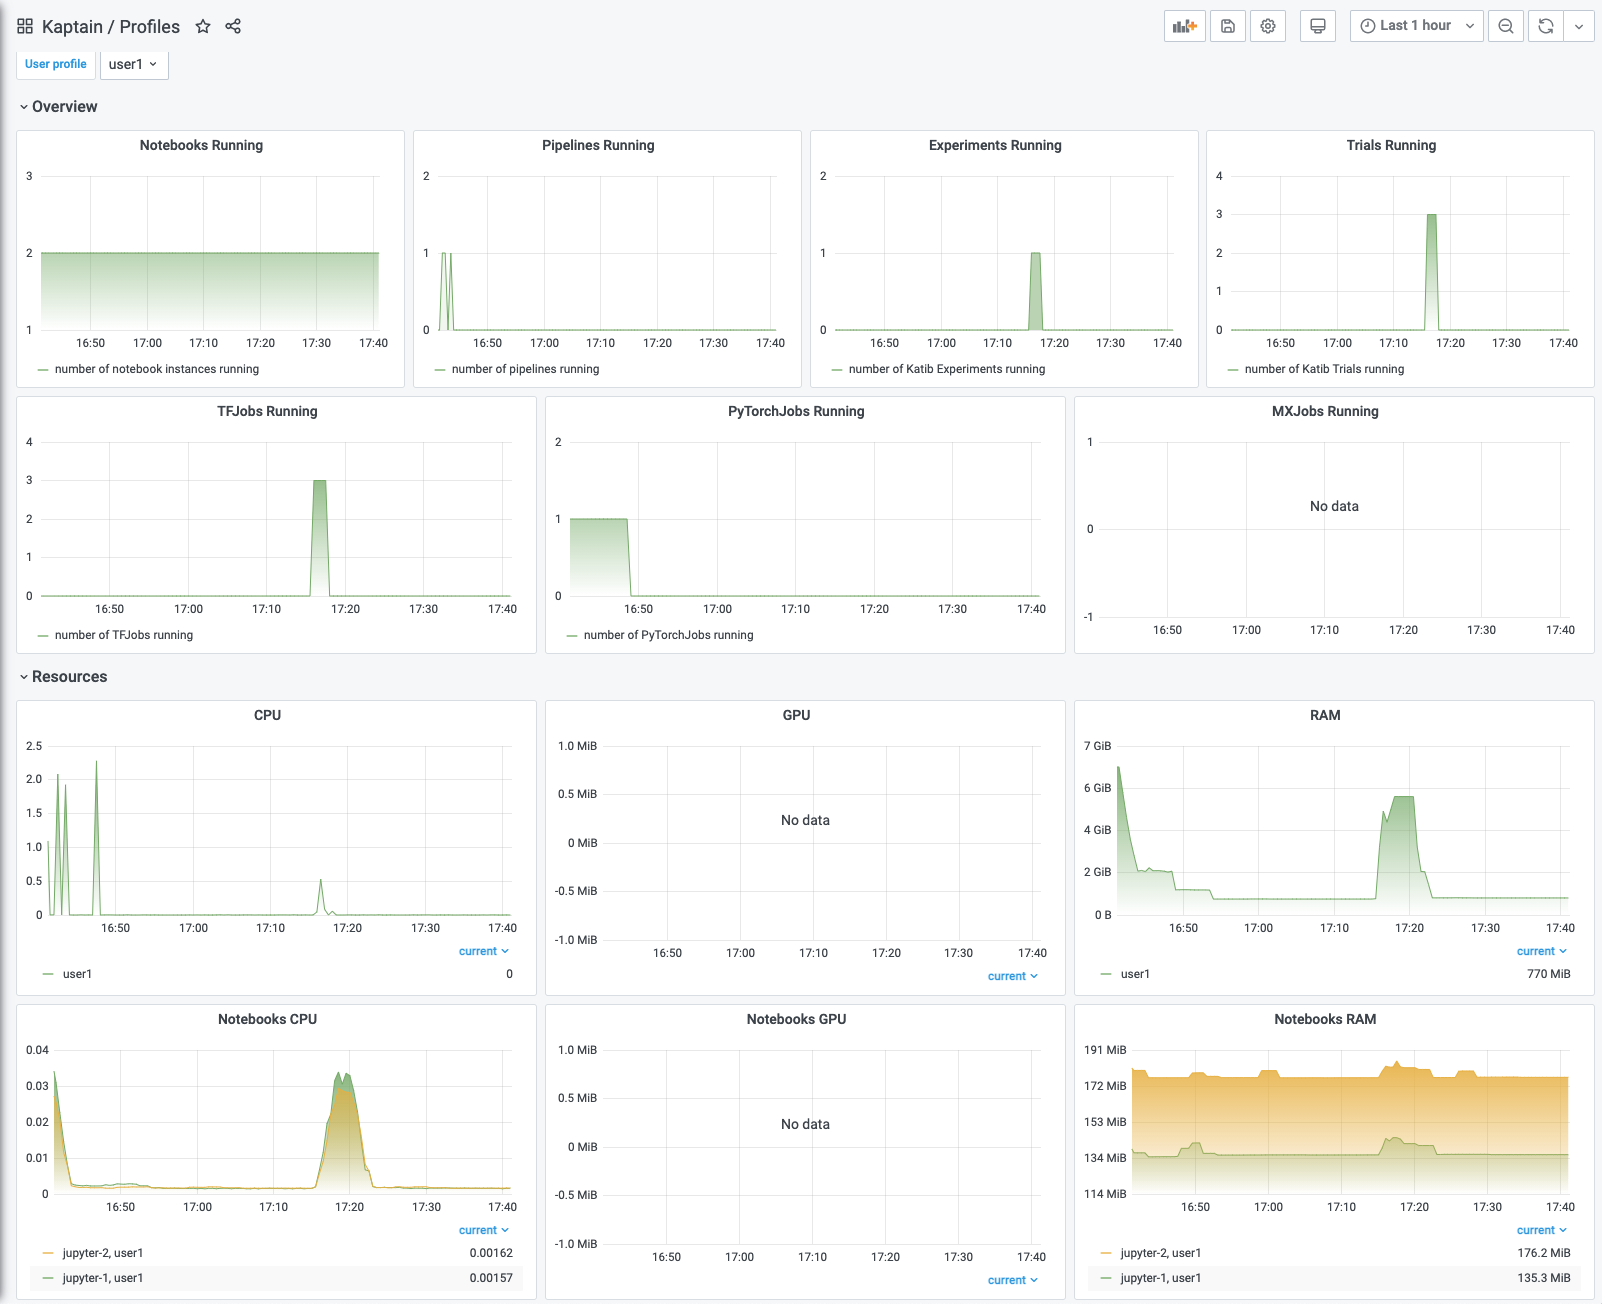
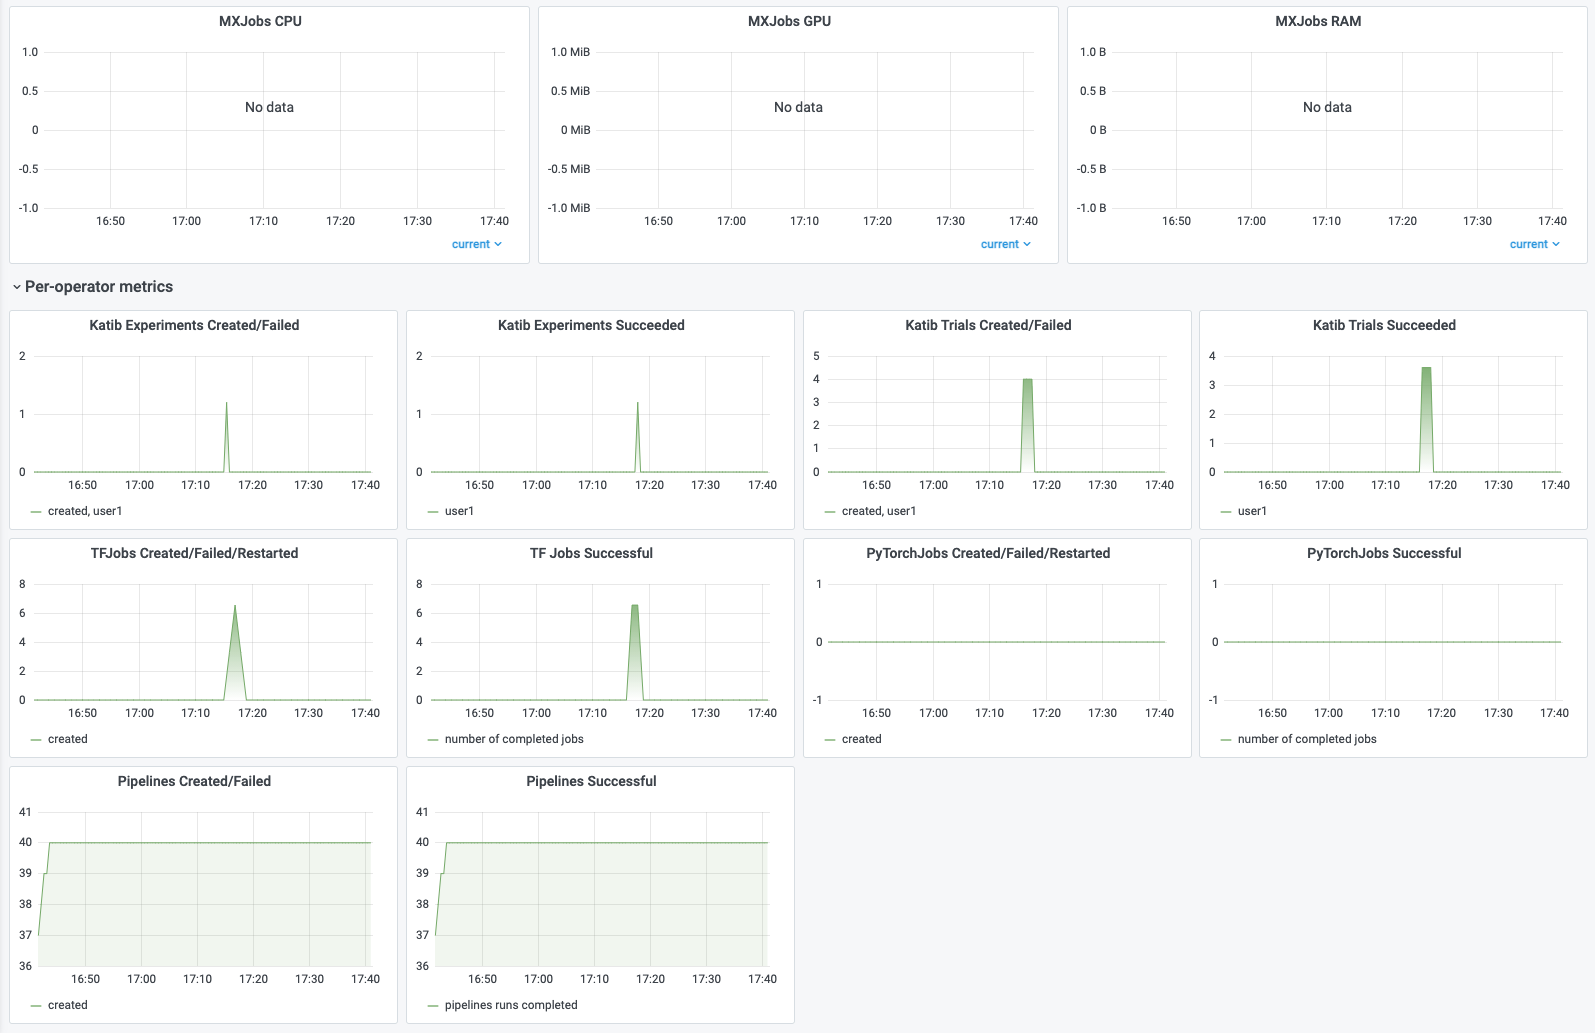
Kaptain / Profiles - provides the workload visualizations and resource consumption metrics for each
Profile: