Kaptain Dashboards
General Monitoring
Access the dashboard application for Kaptain, from the Kubeflow UI.
Select Dashboard in the sidebar menu.
The Dashboard page consists of four sections. To select a time range for graphs, use the Time Period control in the top-right corner.
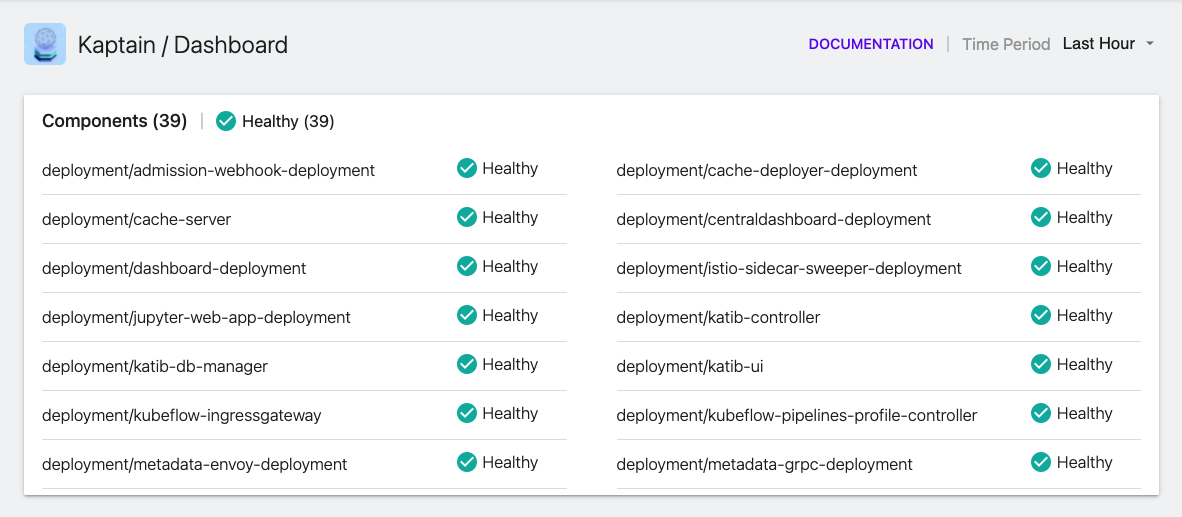
The top section contains an overview of the current health of Kaptain components.
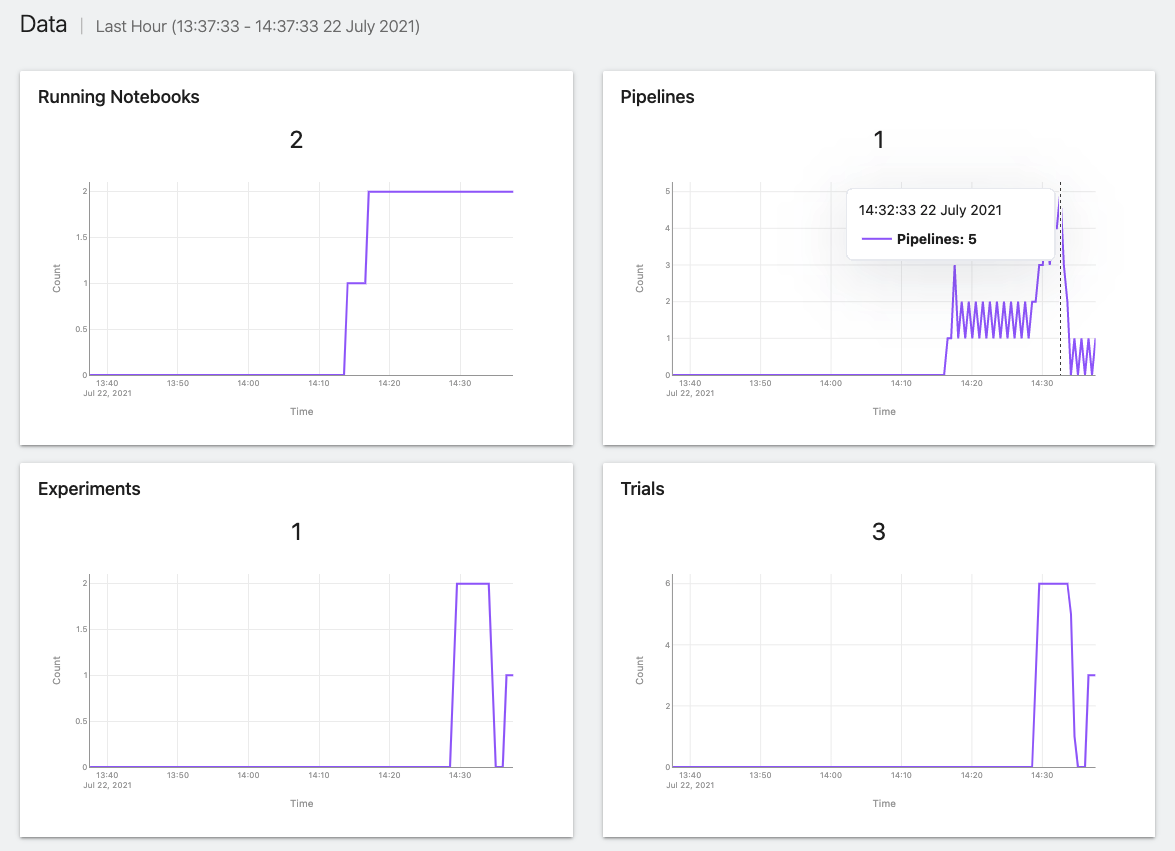
The Data section provides the information about what is currently running in a user’s namespace; the graphs show the number of active notebooks, pipelines, ML experiments, and trials:
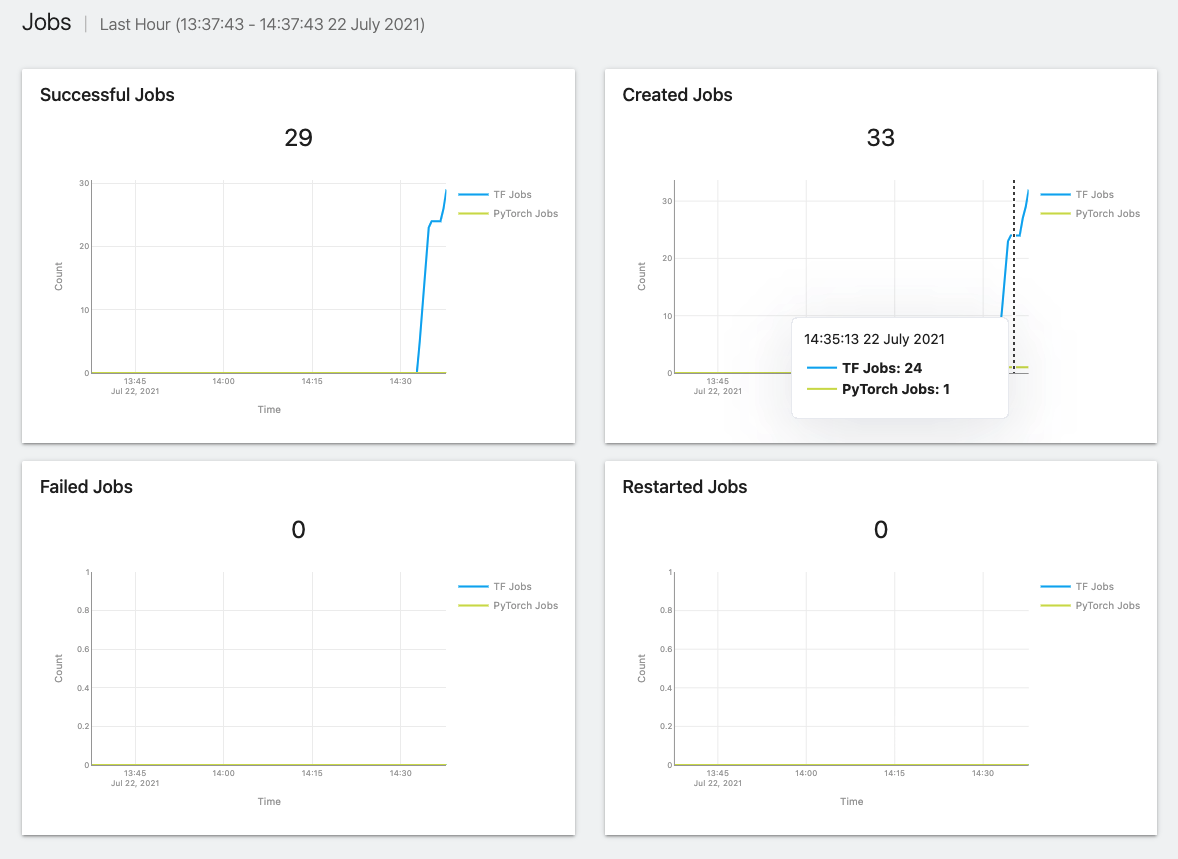
In the Jobs section, users can get the current state of machine learning jobs, for example how many TFJob or PytorchJob resources were created, completed, or failed:
The System Resources section is all about resource consumption. The graphs show how many resources are being used by workloads in the user’s namespace. Kaptain has three graphs for each type of resource:
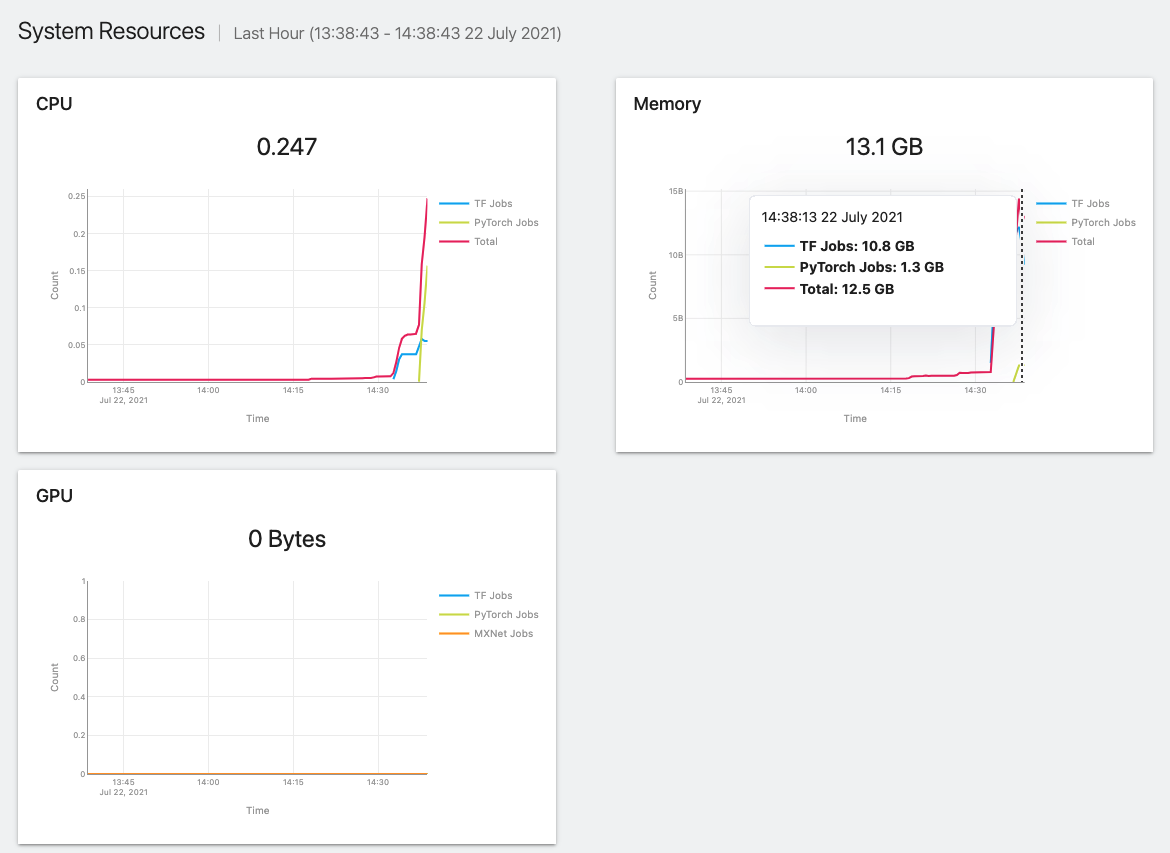
CPU: the number of utilized CPU cores
Memory: how much memory is being used by training jobs and other pods
GPU: how much GPU memory is being utilized
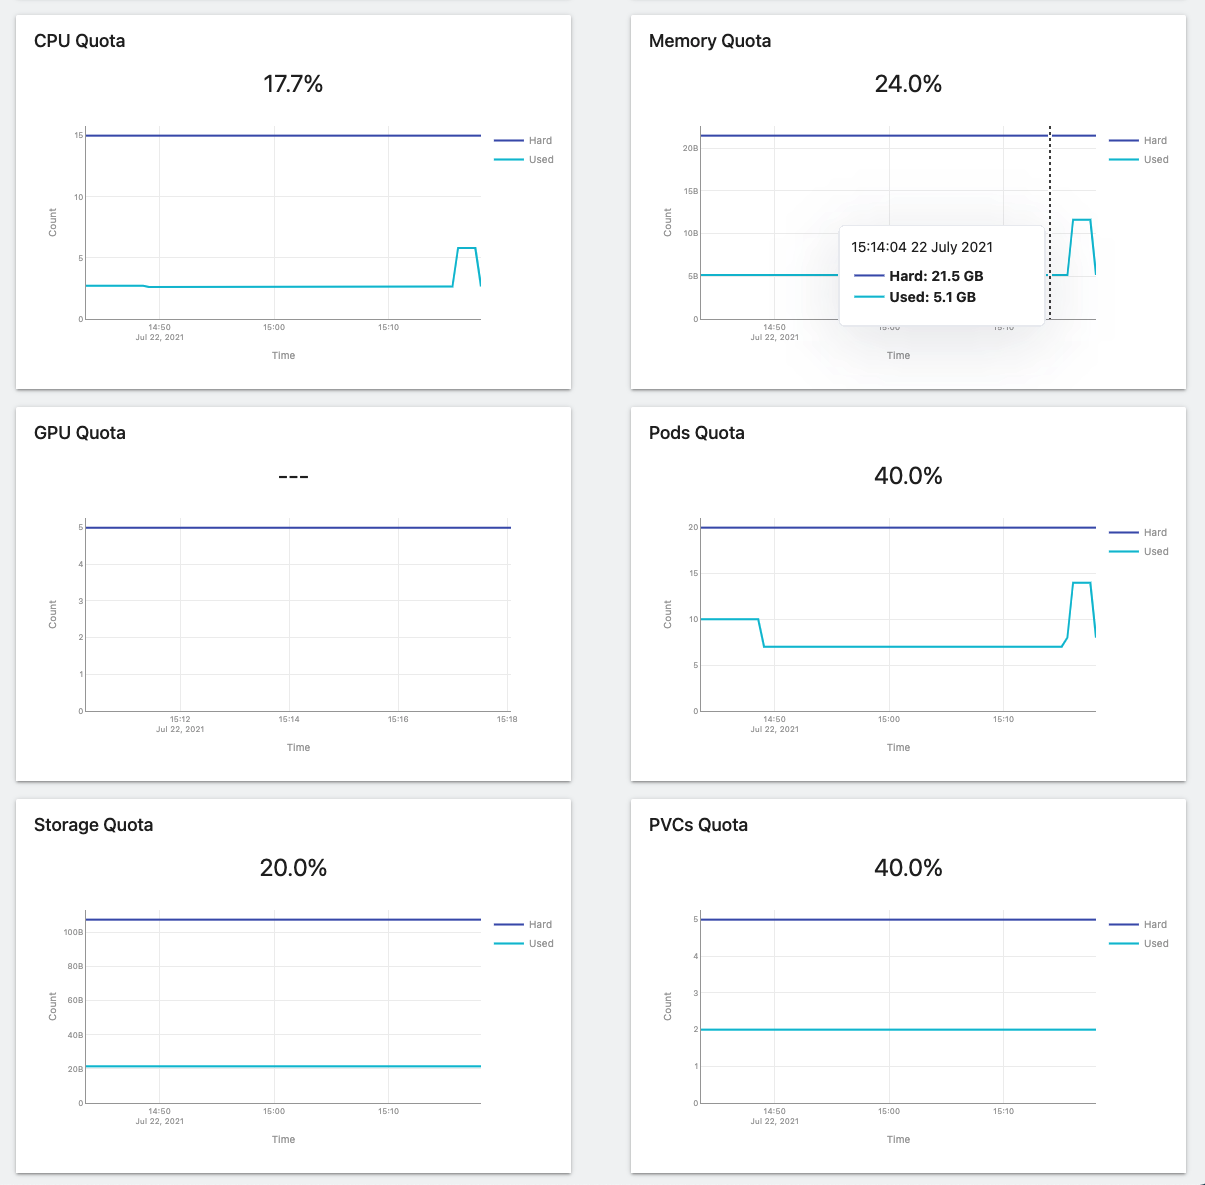
If resource quotas are set for the user’s namespace, the following graphs will be displayed depending on what quotas types are enabled: