View Cluster Log Data
How to view the cluster's log data after enabling logging.
Though you enable logging at the Workspace level, viewing the log data is done at the cluster level, using the cluster’s Grafana logging URL.
Run the following commands on the management cluster:
Execute the following command to get the namespace of your workspace:
CODEdkp get workspacesAnd copy the value under the
NAMESPACEcolumn for your workspace.Set the
WORKSPACE_NAMESPACEvariable to the namespace copied in the previous step:CODEexport WORKSPACE_NAMESPACE=<WORKSPACE_NAMESPACE>Run the following commands on the attached cluster to access the Grafana UI:
Ensure you switched to the correct context or kubeconfig of the attached cluster for the following kubectl commands:
Get the Grafana URL:
CODEkubectl get ingress -n ${WORKSPACE_NAMESPACE} grafana-logging -o go-template='https://{{with index .status.loadBalancer.ingress 0}}{{or .hostname .ip}}{{end}}{{with index .spec.rules 0}}{{with index .http.paths 0}}{{.path }}{{end}}{{end}}{{"\n"}}'
To view logs in Grafana:
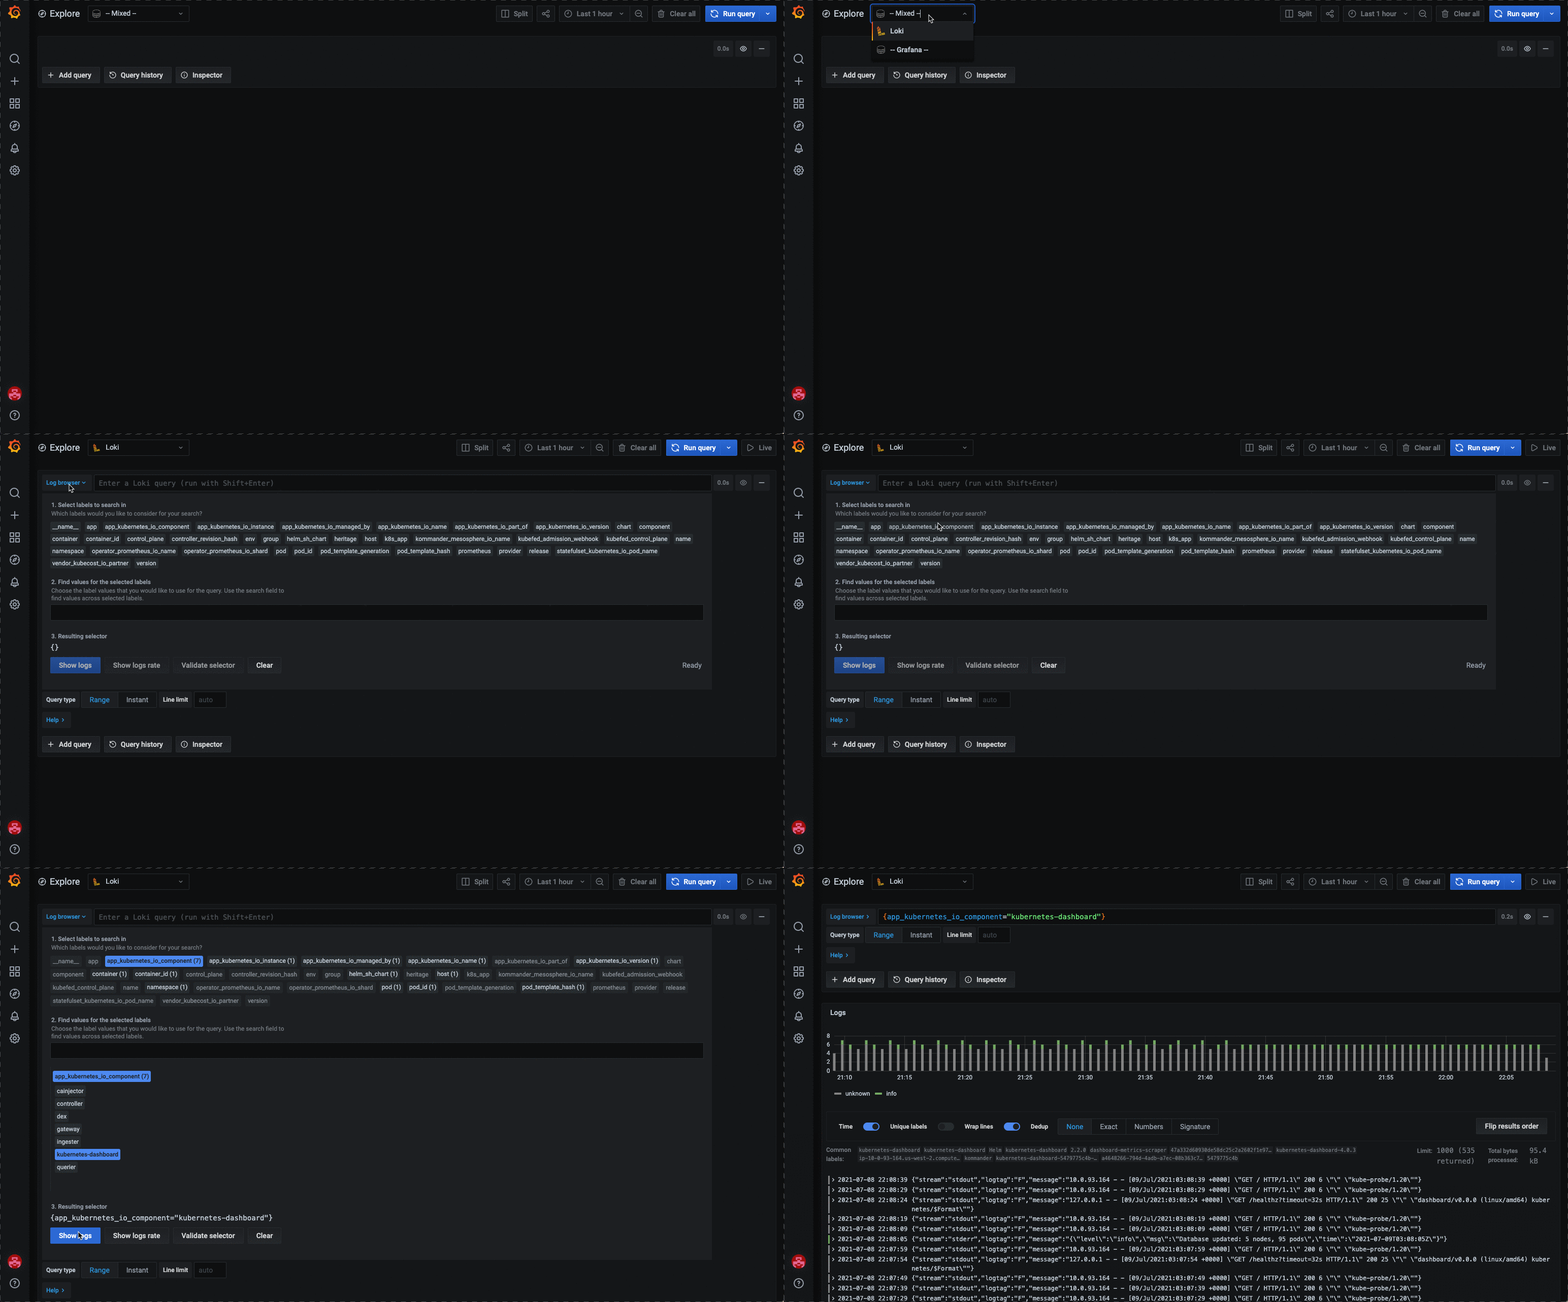
Go to the Explore tab:
CODEkubectl get ingress -n ${WORKSPACE_NAMESPACE} grafana-logging -o go-template='https://{{with index .status.loadBalancer.ingress 0}}{{or .hostname .ip}}{{end}}{{with index .spec.rules 0}}{{with index .http.paths 0}}{{.path }}{{end}}{{end}}/explore{{"\n"}}'You may be prompted to log in using the SSO flow. See Authentication and Authorization for more information.
At the top of the page, change the datasource to
Loki.
See the Grafana Loki documentation for more on how to use the interface to view and query logs.
@

Cert-Manager and Traefik must be deployed in the attached cluster to be able to access the Grafana UI. These are deployed by default on the workspace.
