Logging
D2iQ Kubernetes Platform (DKP) ships with a pre-configured logging stack that allows you to collect and visualize pod and admin log data at the Workspace level. The logging stack is also multi-tenant capable. Multi-tenancy is enabled at the Project level through role-based access control (RBAC).
By default, logging is disabled on managed and attached clusters. You need to enable the logging stack applications explicitly on the workspace to make use of these capabilities.
The primary components of the logging stack include these platform services:
BanzaiCloud Logging-operator
Grafana and Grafana Loki
Fluentbit and Fluentd
In addition to these platform services, logging relies on other software and system facilities, including the container runtime, the journald facility, and systemd configuration are used to collect logs and messages from all the machines in the cluster.
The following diagram illustrates how different components of the logging stack collect log data and provide information about clusters:
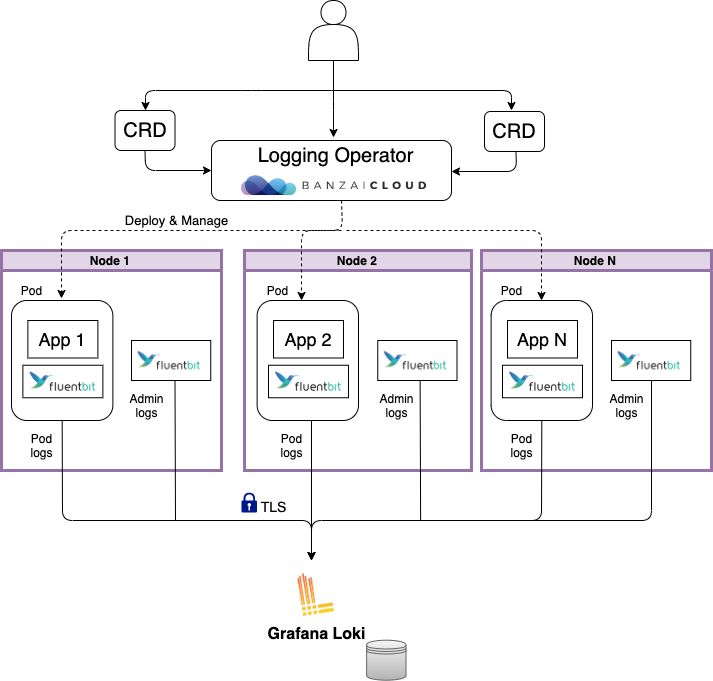
The DKP logging stack aggregates logs from applications and nodes running inside your cluster.
DKP uses the BanzaiCloud Logging-operator to manage the Fluentbit and Fluentd deployments that collect pod logs, using Kubernetes API extensions called custom resources. The custom resources allow users to declare logging configurations using kubectl commands. The Fluentbit instance deployed by Logging-operator gathers pod logs data and sends it to Fluentd, which forwards it to the appropriate Grafana Loki servers based on the configuration defined in custom resources.
Loki then indexes the log data by label and stores it for querying. Loki maintains log order integrity but does not index the log messages themselves, which improves its efficiency and lowers its footprint.
Admin-level logs
DKP also includes a Fluentbit instance to collect admin-level log information which is sent to the workspace Grafana Loki that’s running on the cluster. The admin log information includes:
Logs for host processes managed by systemd
Kernel logs
Kubernetes audit logs
This approach helps to isolate the more sensitive logs from Logging-operator, eliminating the possibility that users might gain inadvertent access to that data.
See Fluent Bit for more information about these logs.
On the Management cluster, the Fluentbit application is disabled by default. The amount of admin logs ingested to Loki requires additional disk space to be configured on the grafana-loki-minio Minio Tenant. Enabling admin logs may use around 2GB/day per node. See Release Notes 2.3.0 | Configuring-the-Grafana-Loki-Minio-Tenant for more details on how to configure the Minio Tenant.